Profiling
Profiling an application means recording information about its performance to find out where time goes and how to make it faster.
Plasma has a profiling system built in. In every build except Shipping, it constantly records the timing of profiling scopes on every thread, and GPU pass timings, into ring buffers. You can look at that data live in the editor's Profiler panel or the Inspector, save it to a file at any time, or stream it into Tracy.
| Tool | Use it for |
|---|---|
| Profiler panel | Live CPU and GPU timelines, call trees, counters and hitches of the scene you are editing or playing. |
| Profiling overlays | A quick frame-time readout in the viewport or game. |
| Captures | Saving a capture to a file to look at later or attach to a bug report. |
| Tracy | Deep, nanosecond-level analysis with memory tracking. |
| GPU Dump | Everything about one rendered frame: passes, resources, constants. |
Profiler panel
Open it with Panels › Profiler, or click the frame rate in a document's status bar.

Choosing what to profile
The Source menu at the left of the toolbar picks where the data comes from:
| Source | Shows |
|---|---|
| Engine process · scene | The engine process that renders and simulates the open scene. This is what you want for game performance. |
| Engine + Editor process (merged) | Both processes on one timeline. |
| Editor process only | The editor itself, for example when the editor UI feels slow. |
| File: name | A .plprof capture you opened. |
| Linked editor · host | With Editor Link connected: the profiler of the linked editor. |
| This engine process + host (compare) | Both side by side, to compare two machines. |
Toolbar
From left to right:
- Live / Paused: pauses the live view so you can inspect frames. Previous frame and Next frame step through the recorded frames.
- Detail: how much is recorded: Summary, Frame, Full (scopes down to 0.005 ms) or Deep (scopes and CPU samples).
- Record: starts and stops recording a capture.
- Bookmark: marks the current frame.
- Open and Save: load and save
.plprofcaptures. - Toggle profiler overlay in the viewport (editor only): sets
Profiler.Overlay, see below. - Dump selected GPU pass (editor only): takes a GPU Dump.
- Budget: the frame budget the colours are measured against: 30 Hz (33.33 ms), 60 Hz (16.67 ms) or 120 Hz (8.33 ms). It sets
Profiler.FrameBudgetMS. - Thread: limits the views to one thread.
- More: Deep capture (120 frames), Export Chrome trace..., Export CSV..., Export digest... (a Markdown summary) and Open Inspector.
Below the toolbar a status row shows the selected frame's frame time, CPU and GPU time and whether the frame was CPU- or GPU-bound. It says Waiting for profiler data until the first frame arrives.
Views
- Frame strip: one bar per frame, coloured by what bound it, with frames over budget and hitches highlighted. Click a frame to select it, Shift-drag to select a range, and use the mouse wheel to show more or fewer frames.
- Scope details: with nothing selected, a summary of the frame (CPU, GPU, waiting, what bound it, budget headroom and how busy each thread was). With a scope selected, its self time, average, minimum, maximum and 95th percentile and a sparkline.
The tabs in the middle switch between:
| Tab | Shows |
|---|---|
| Timeline | One lane per CPU thread and per GPU queue, with every scope as a block. Mouse wheel zooms, dragging pans, clicking selects a scope, clicking a lane name collapses it. A Flame mode stacks the scopes as a flame graph. |
| Call tree | Scopes aggregated by call path, with total and self time. |
| GPU passes | Every render pass grouped by view, with its queue, GPU time, CPU recording time, draws, dispatches and barriers. Double-click a pass in the editor to take a GPU Dump of it. |
| Counters | Graphs of counters (PL_PROFILE_COUNTER) and stats. |
| Memory, Leaks | Memory use over time and possible leaks. |
| Hitches | Frames that took much longer than their neighbours. Profiler.HitchThresholdMS sets the threshold (0 picks one automatically). |
| Samples | CPU samples from Deep captures, for code that has no profiling scopes. |
| Compare | Two captures or sources against each other. |
| Markers | Events such as play start, asset reloads, shader compiles and hot reloads, also drawn on the timeline. |

Typical workflow
- Open the scene and press Play, so you profile the running game.
- Open Panels › Profiler and set Budget to your target frame rate.
- Play to the slow part. Watch the frame strip: red bars are frames over budget.
- Click Live to pause, select a slow frame, and read the status row to see whether it is CPU- or GPU-bound.
- CPU-bound: open Timeline or Call tree and select the widest scopes. GPU-bound: open GPU passes and double-click the most expensive pass for a GPU Dump.
- Save the capture as
.plprof, or use More › Export Chrome trace... to share it.
Overlays and frame stats
| CVar | Default | Description |
|---|---|---|
Profiler.Overlay | off | A panel in the viewport or game with frame, CPU and GPU times, what bound the frame and a graph of the last 120 frames. |
App.ShowFPS | off | Frame rate counter. F5 toggles it in the Player. |
App.ShowInfo | off | Application and renderer information. |
Rendering.Memory.Hud | off | GPU memory, see Texture Streaming. |
App.LogFrameStats | 0 | Every this many seconds, writes frame stats to the log (0 is off). App.LogFrameStats.Prefixes picks which stats. |
Rendering adds more detail when these are on (all off by default): Rendering.Profiling.GPUStats (GPU timing even when no profiler is listening), Rendering.Profiling.RecordStats, Rendering.Profiling.RecordDetails, Rendering.Profiling.ExtractionStats and Rendering.Stats.DrawCost.
Saving captures
In the editor
Tools › Save Editor Profiling Data (Ctrl+Alt+P) saves the recent profiling data of the editor and its engine process. It writes profilingEditor.json, profilingEngine.json, a merged profiling_<date>.json and, from that, a .tracy file you can open in Tracy. The status bar says where:

You can reach the folder by typing %appdata% into the address bar of Windows Explorer.
To capture the editor's own startup, start it with -saveProfilingAfter <seconds>. EditorProcessor accepts -profiling.
In a game or the Player
Press F8, or run the console function TakeProfilingCapture. The capture is written to Profiling/<AppName>_<timestamp>.json in the application's data folder under %appdata%, and the log says where.
Shipping builds contain no profiling scopes, so there is nothing to capture.
Viewing a capture
.plprof files open in the Profiler panel (Open) and in the Inspector (Open Profile (.plprof)...).
.json captures are in Chrome Tracing Format. Open them at ui.perfetto.dev or chrome://tracing:
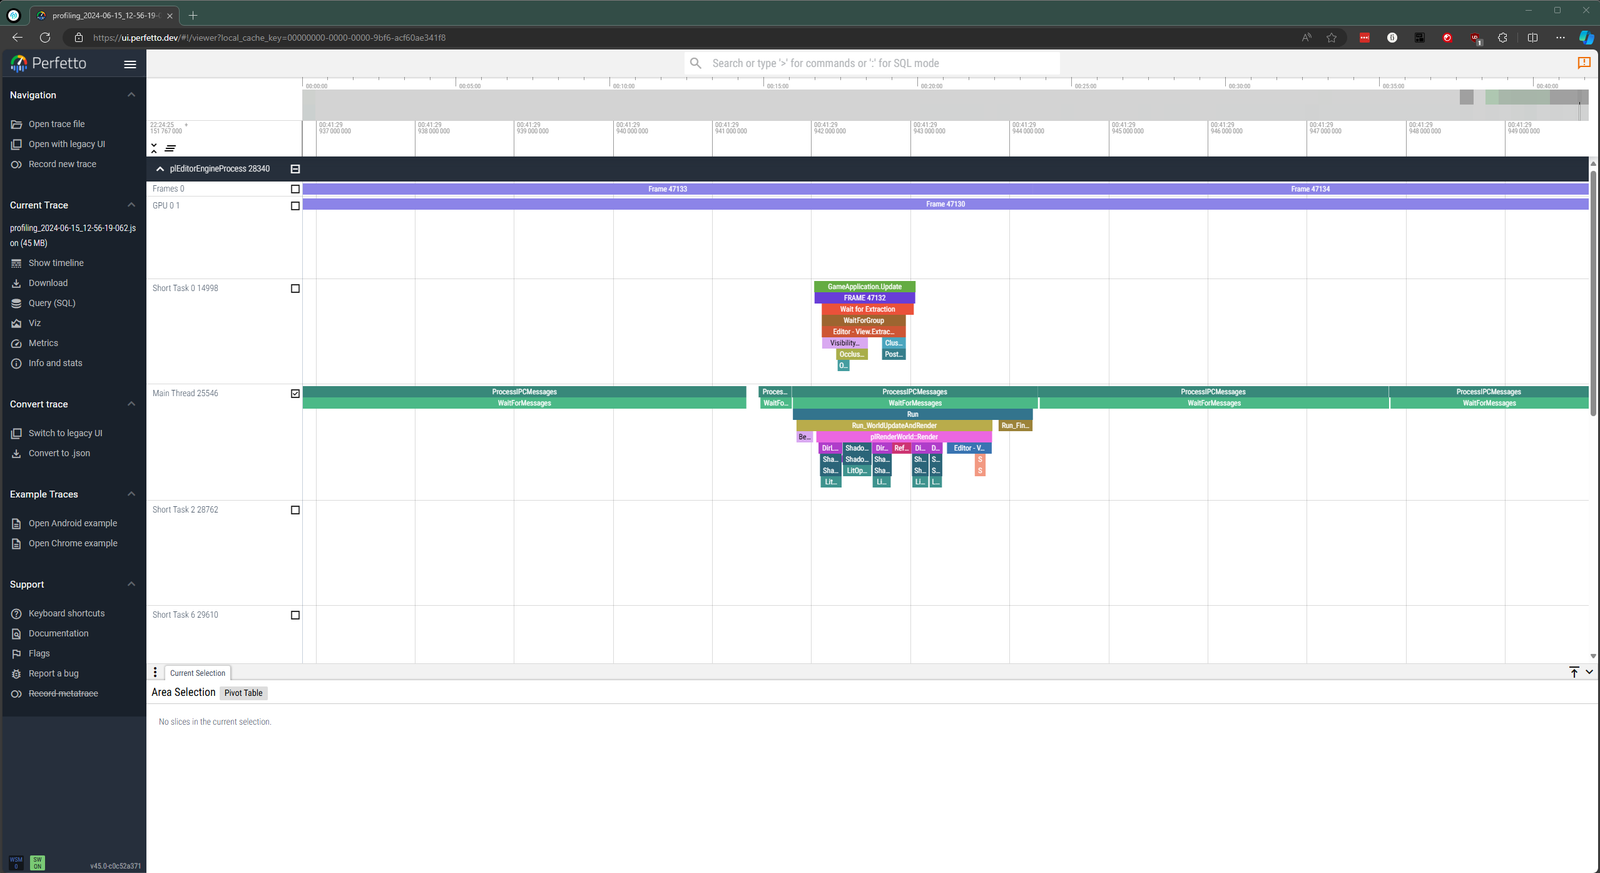
Each block represents a profiling scope; blocks below others are nested scopes. In chrome://tracing, W and S zoom, A and D scroll sideways, and the mouse wheel scrolls up and down.
Tracy
Tracy is built into the engine on Windows in Debug and Development builds (not Shipping). It only records while the Tracy application is connected, so it costs nothing otherwise.
- Start your game, or play in the editor.
- Choose Tools › Launch Tracy.... This starts the Tracy application that ships with the engine (
Data/Tools/Precompiled/Tracy.exe). - In Tracy, select the running application in the list of discovered clients and connect. Tracy uses its default port, 8086.
Tracy shows the same profiling scopes with higher precision, plus memory allocations. It can also open the .tracy files that Save Editor Profiling Data writes.
GPU profiling
GPU pass timings are recorded while a profiler is listening (the Profiler panel, the Inspector or Tracy) or Rendering.Profiling.GPUStats is on. They appear as GPU lanes in the timeline and in the GPU passes tab.
For a deep look at one frame, use GPU Dump: Tools › GPU Dump (Ctrl+Alt+G). It captures every pass of a frame with its timing, resources, commands and constants in a browser-based viewer.
Profiling custom code
Add a profiling scope to any C++ scope you want to time:
void MyFunc()
{
  PL_PROFILE_SCOPE("MyFunc");

  // ... do stuff ...
}
The time from the macro to the end of the scope is recorded and shows up in every tool above.
| Macro | Use |
|---|---|
PL_PROFILE_SCOPE(Name) | Times the enclosing scope. |
PL_PROFILE_SCOPE_WITH_TIMEOUT(Name, Timeout) | Like above; when the scope takes longer than Timeout, the callback set with plProfilingSystem::SetScopeTimeoutCallback() runs. |
PL_PROFILE_LIST_SCOPE(ListName, FirstSection) and PL_PROFILE_LIST_NEXT_SECTION(Name) | Splits one scope into consecutive sections. |
PL_PROFILE_SCOPE_DEEP(Name, ObjectId) | A scope that is only recorded during Deep profiling, for code that runs very often. |
PL_PROFILE_AND_MARKER(CommandEncoder, Name) | Times a GPU scope and labels it in graphics debuggers. Use it around rendering commands. |
PL_PROFILE_COUNTER(Name, Value) | Records a value per frame for the Counters tab. |
PL_PROFILE_MARKER(Category, Text) | Adds an event to the Markers tab and timeline. Categories: User, Scene, Play, Asset, Shader, HotReload, GC, Stream, Leak. |
All profiling macros compile to nothing in Shipping builds.
Scopes shorter than a threshold are discarded, to save space in the ring buffer, so a very short custom scope may not show up. The threshold is 0.1 ms by default; change it with the CVar Profiling.DiscardThresholdMS or plProfilingSystem::SetDiscardThreshold(). The Full and Deep detail levels in the Profiler panel record shorter scopes.
From code, plProfilingSystem::Capture() collects the current data, and plProfilingUtils::SaveProfilingCapture() writes it to a file.